Challenge
Real car shapes are confidential, and simple test bodies don't behave like real cars. DrivAer, an open car model from TU Munich, fills that gap.
What we did
- Built a virtual wind tunnel around the full-size car
- Solved the flow with open-source OpenFOAM
- Compared it with a published high-fidelity simulation
What we found
- Drag within 5 % of the reference
- Roof pressure closely matches
- Biggest gaps under the car, near the front wheels
Pressure along the car
Our run against the reference, along the car's centreline.
Gallery
Next
The full study in ANSYS Fluent, against TU Munich wind-tunnel data: three rear-end shapes, finer meshes and rotating wheels.
Technical details
About this run
A first steady RANS solution, used to build the workflow before the full study. It uses the full-scale notchback from the open DrivAerML dataset (run 1: detailed underbody, mirrors, static wheels, closed cooling). It is compared with the time-averaged scale-resolving simulation published with that dataset (Ashton et al., 2024), not with the wind-tunnel data. One mesh only, so results are not validated.
| Item | Setting |
|---|---|
| Solver | OpenFOAM v2406, simpleFoam, k-ω SST, full model (no symmetry plane) |
| Conditions | U∞ = 38.9 m/s, Re ≈ 7.2 × 10⁶ based on the 2.786 m wheelbase, as in the reference |
| Domain | x −12 to 28 m, y ±8 m, height 8.3 m. Slip floor ahead of the car, no-slip floor from just before the front wheels, slip top and sides |
| Mesh | snappyHexMesh, 5.32 M cells, 12.5 mm cells on the body (6.25 mm at edges), 3 prism layers (80–96 % coverage on the body panels, less on small parts) |
| Wall treatment | Wall functions. Patch-averaged y⁺ is mostly 30–100 (median 58); a few small parts are higher |
| Wheels | Static (not rotating), as in the reference case |
| Iterations | 1,134, stopped by a drag-averaging rule: the means of two successive 200-iteration windows within 0.3 % (final change 0.15 %) |
| Reference areas | A = 2.17 m², wheelbase 2.786 m, the same as the reference data |
| Result | This run (steady RANS, SST) | DrivAerML reference (DDES, time-averaged) |
|---|---|---|
| Drag coefficient Cd (mean of last 200 iterations) | 0.326 | 0.311 |
| Lift coefficient Cl (mean of last 200 iterations) | 0.089 | 0.069 |
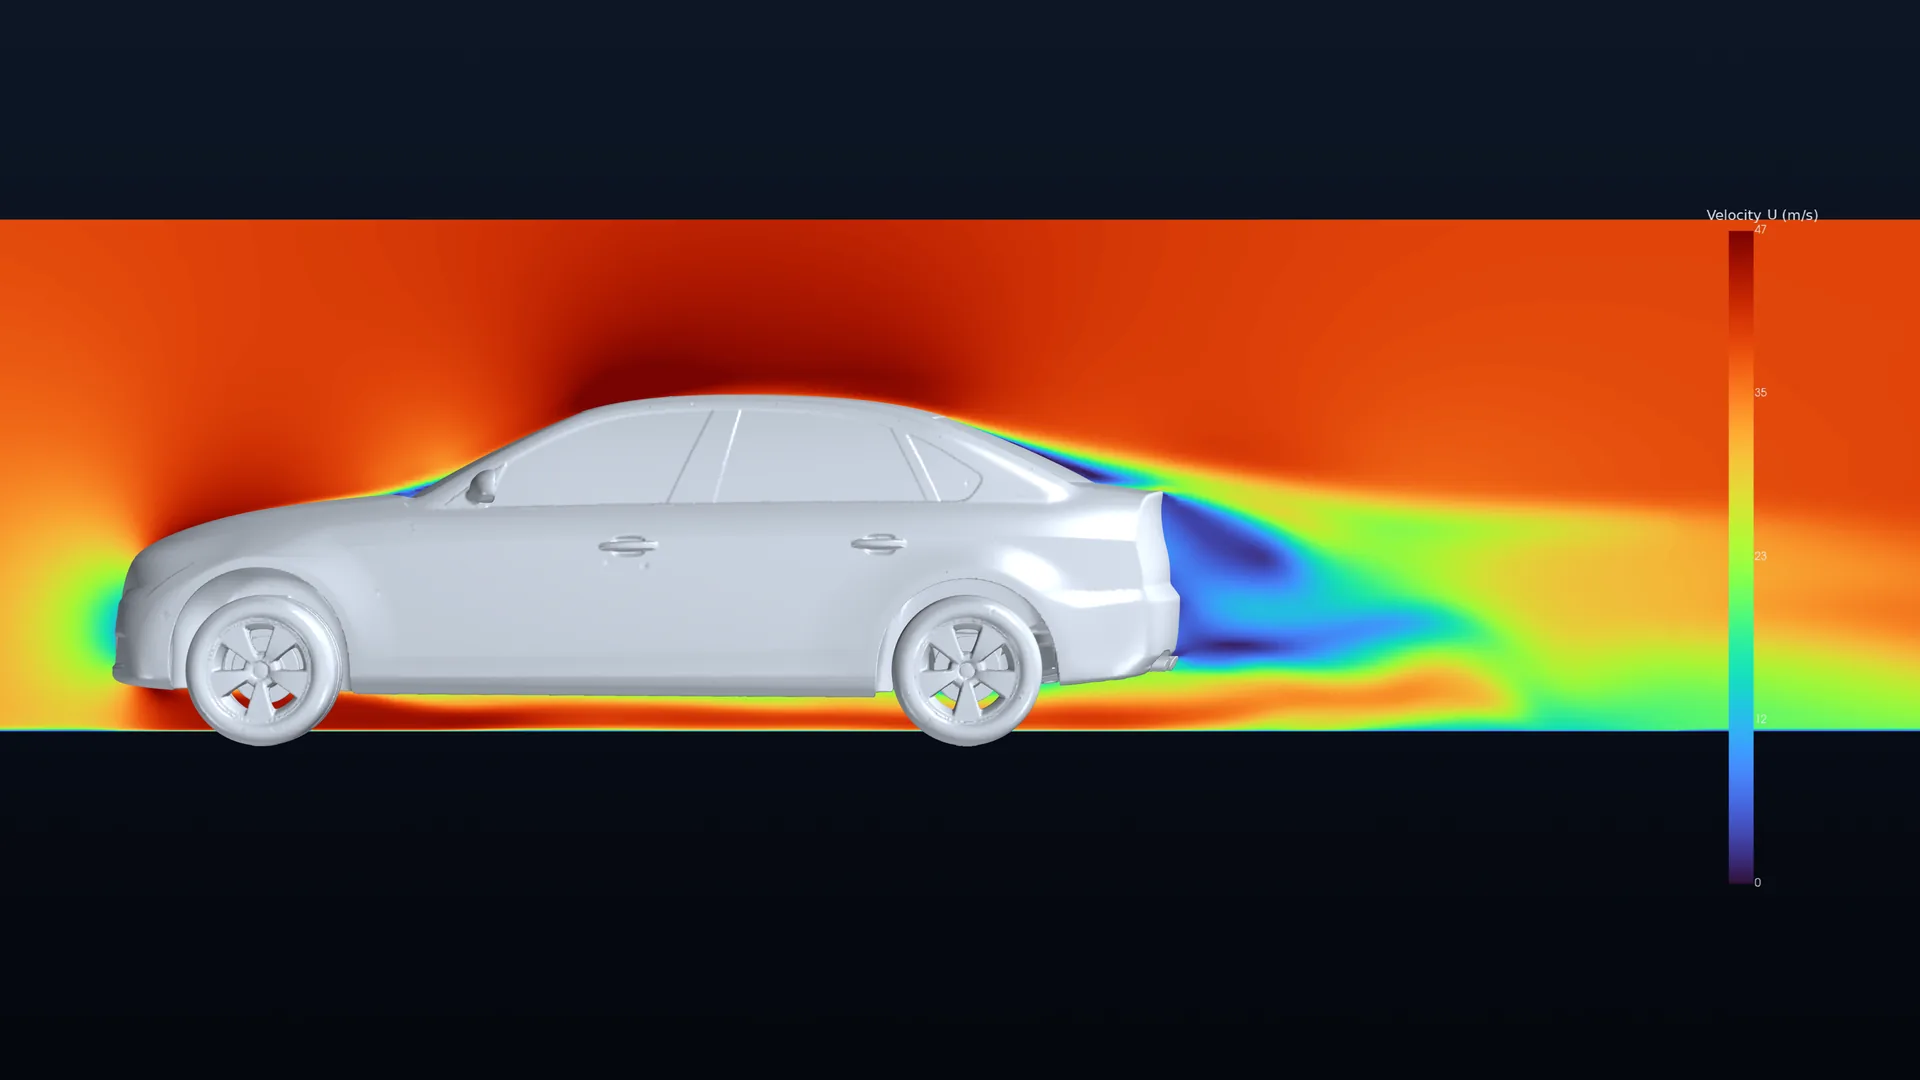
Drag swings by about ±2 % from one iteration to the next (0.318–0.330), so the value is an average. Lift is less well predicted. Most of the difference is expected to come from the wake: steady RANS cannot represent the unsteady separation behind the rear window and boot. Without a mesh study, part of the difference could also be mesh error.
Centreline pressure. Over the upper surface the median difference is 0.011 in Cp (90 % of points within 0.05); the largest differences (up to 0.3) are at the base of the windscreen, the windscreen-to-roof junction and the boot edge. Under the car the median difference is 0.046 (90 % within 0.15); the largest (up to 0.7) are around the front axle, where the detailed underbody has many small parts.
Images and 3D model
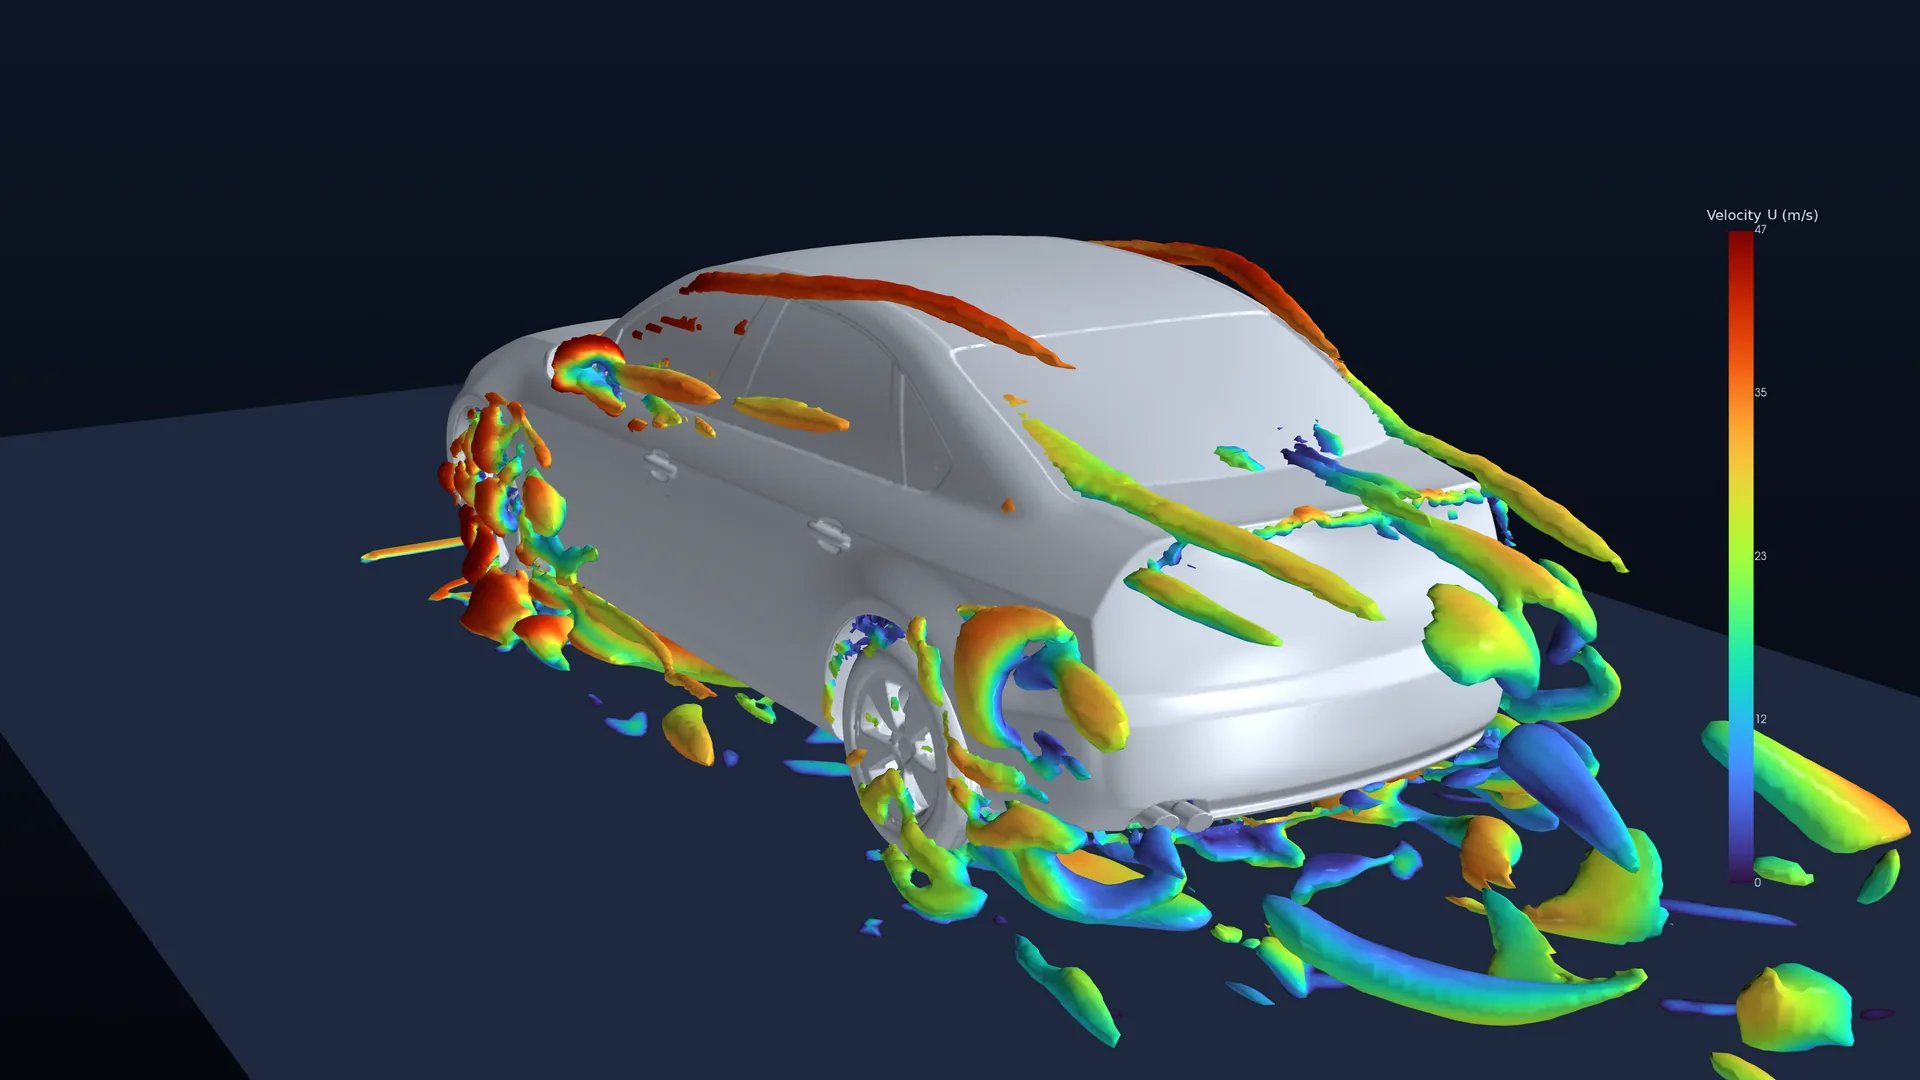
- Vortices: Q-criterion iso-surface (Q = 4000 s⁻²), coloured by velocity, hidden within 40 mm of the body.
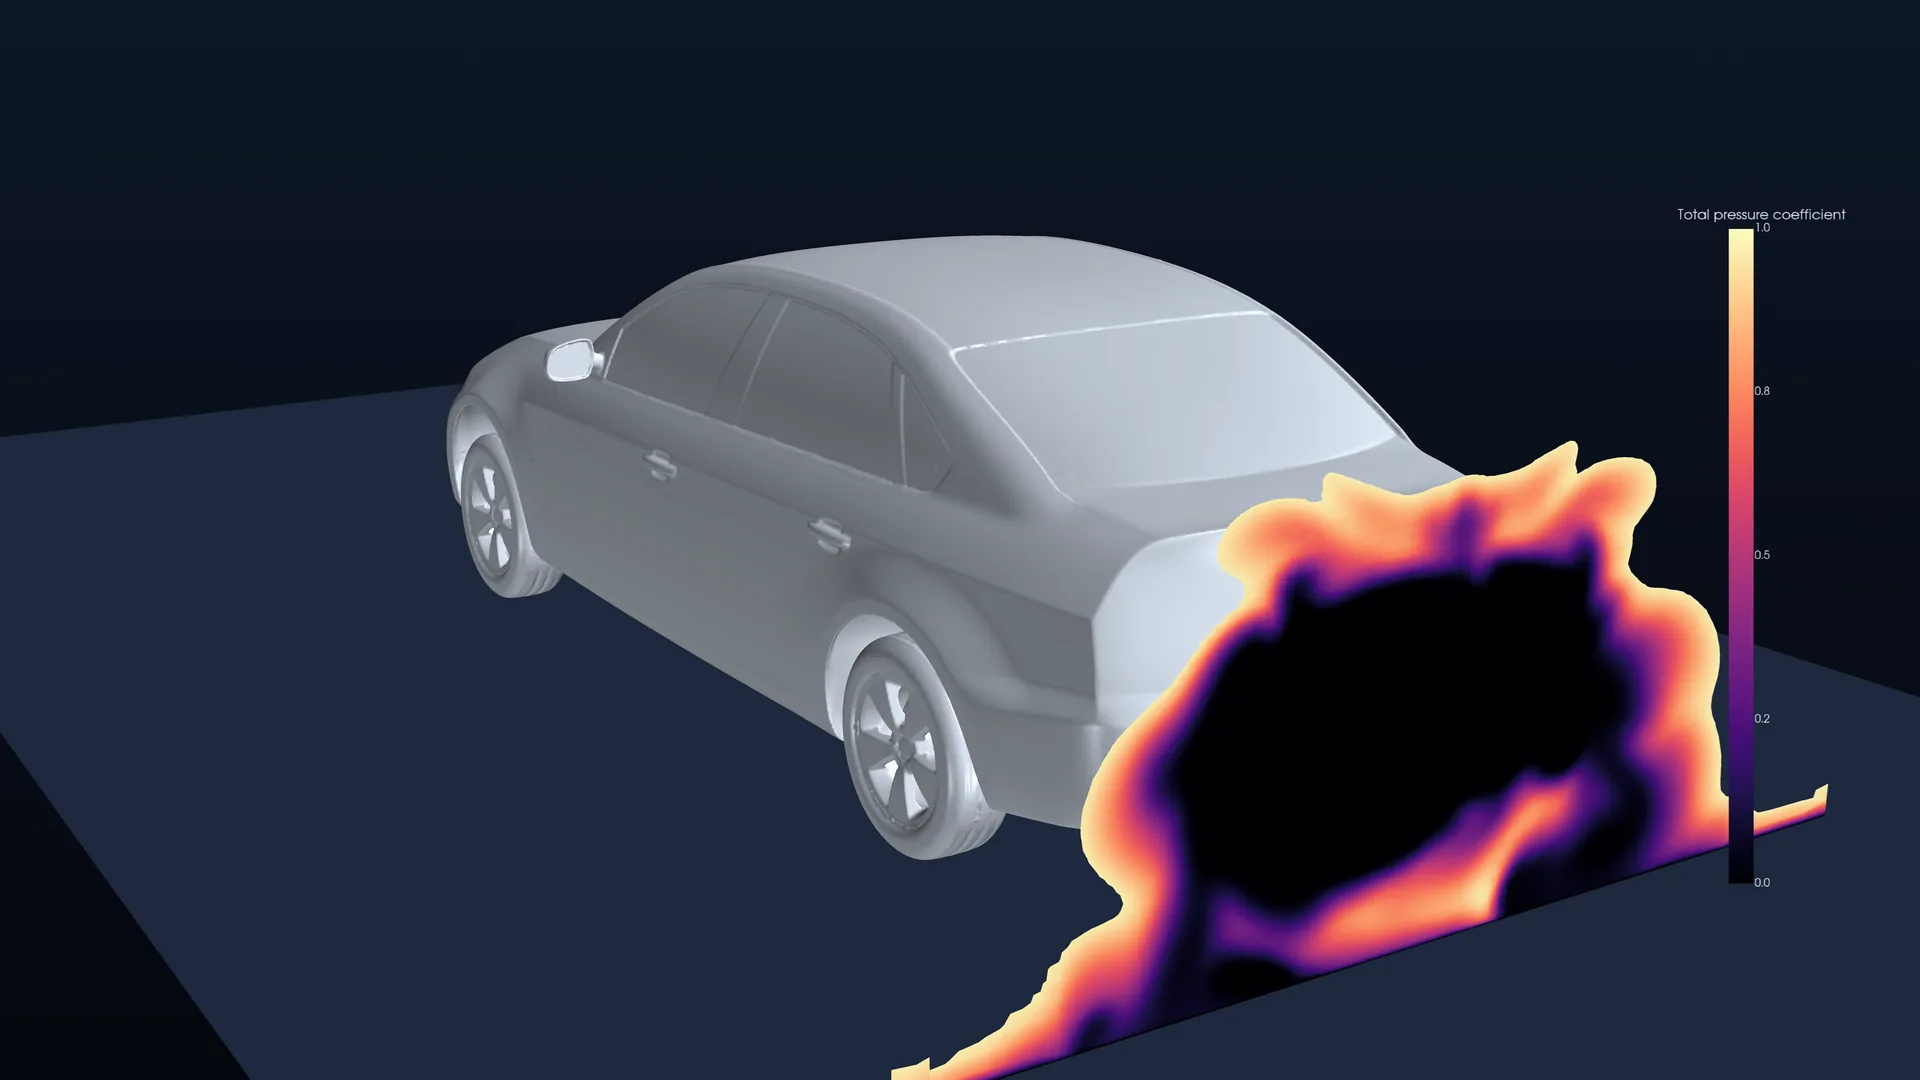
- Wake: total-pressure coefficient on a cross-plane about 0.26 m behind the rear bumper; only the region with a loss (Cp,total < 0.97) is shown.
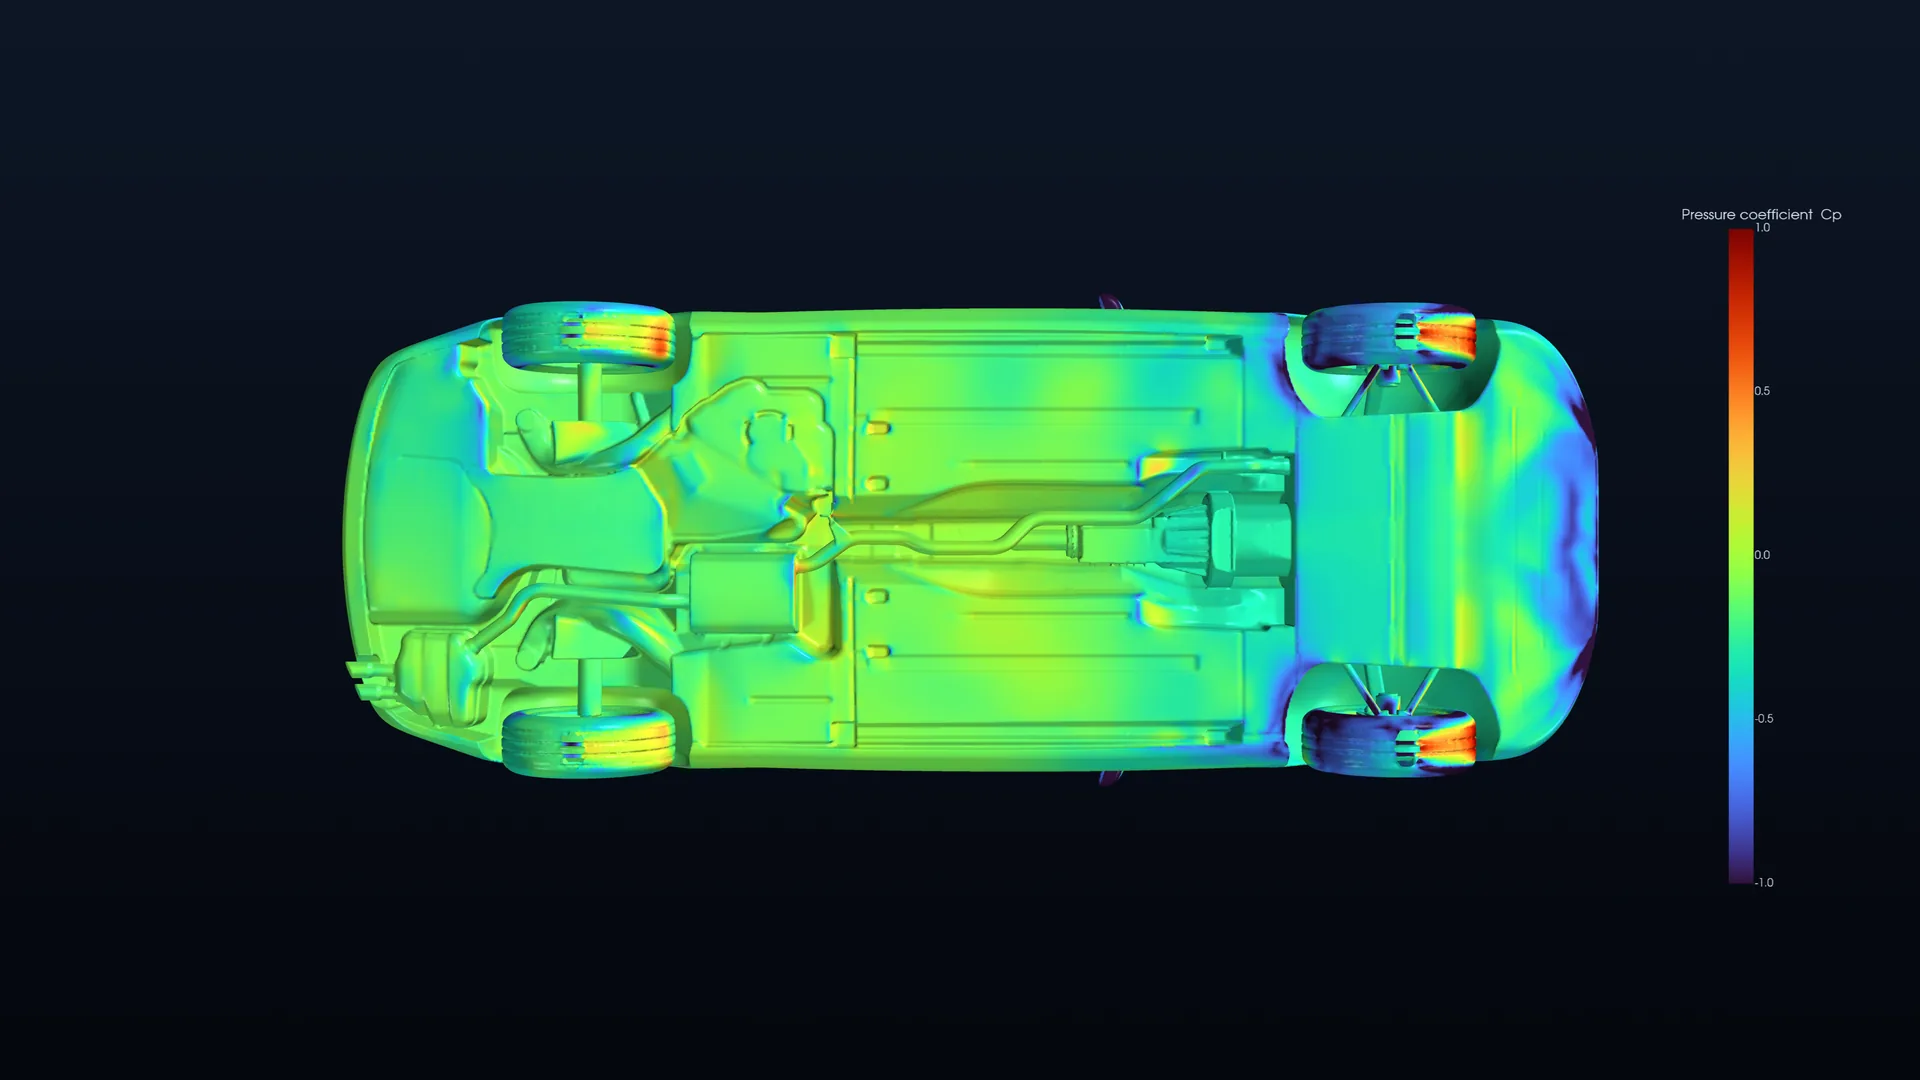
- Underbody: seen from below with the nose on the right.
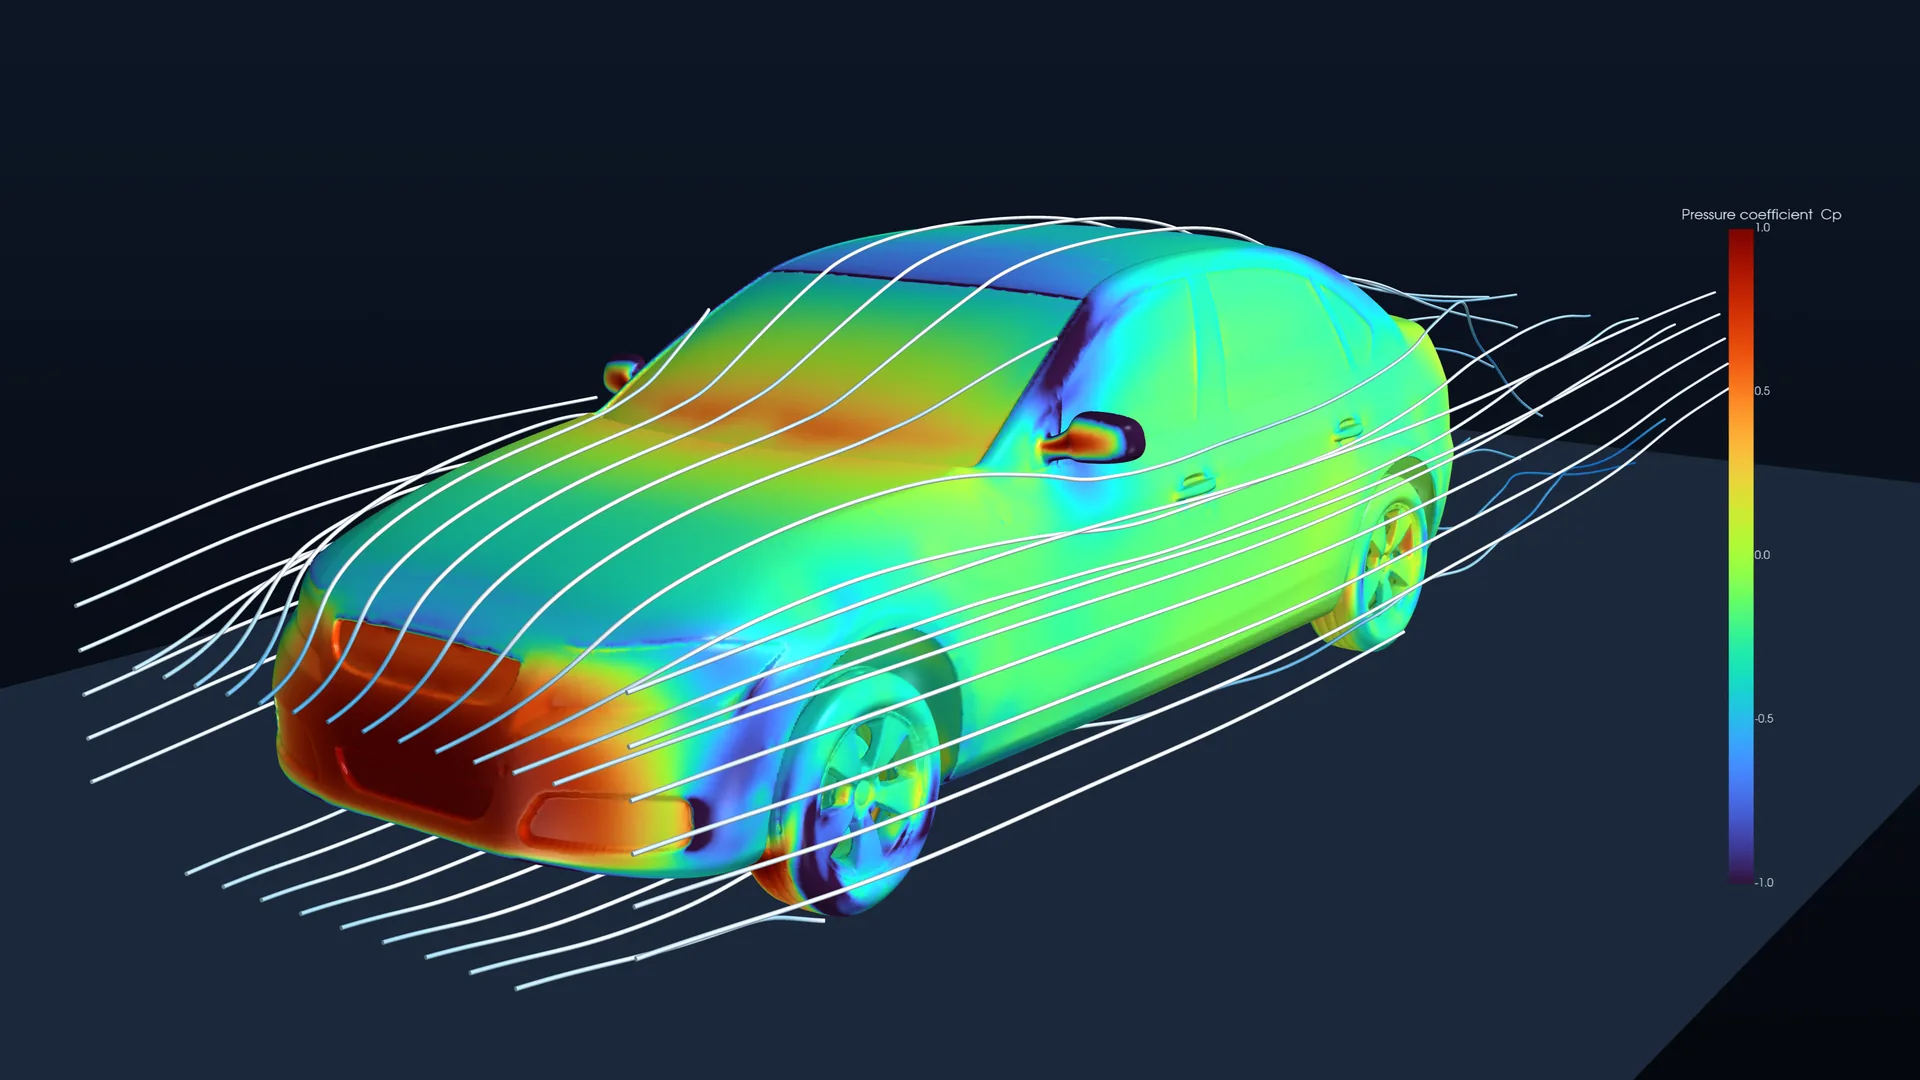
- Streamlines are integrated on a uniform resampling of the near-body field, so they do not resolve the near-wall layers.
- Cp uses the outlet pressure as reference (p = 0) and is clipped at ±1.
- 3D model: surface simplified for the web (about 290,000 triangles). The realistic paint, glass and tyre materials are for presentation only.
- Centreline comparison: top-most and bottom-most surface points in 10 mm bins along x. Bins whose point lies more than 30 mm inside the outer surface are dropped, for both datasets alike.
- Reference data: DrivAerML (Ashton et al., 2024), CC BY-SA 4.0.
Planned study
| Parameter | Value |
|---|---|
| Model | DrivAer, 1:2.5 scale |
| Configurations | Fastback (primary), with notchback and estateback as comparisons |
| Underbody | Smooth (first stage), detailed (second stage) |
| Mirrors / wheels | With mirrors, with wheels |
| Facility | TUM Wind Tunnel A |
| Measured | Drag and lift forces, surface pressures along the centreline and other sections |
- Geometry: official DrivAer CAD, repaired into a watertight surface in Fluent Meshing.
- Domain: about 3 car lengths upstream, 7 downstream and 5 to the side and above; stationary floor, or moving ground with rotating wheels, as in the test.
- Mesh: poly-hexcore with wake and underbody refinement, 10–15 prism layers (y⁺ ≈ 1 with SST, or 30–100 with wall functions as a comparison).
- Physics: steady RANS (k-ω SST against Realizable k-ε), then an optional SBES/DES run on the fastback.
- Wheels: rotating-wall condition on the tyres, compared with MRF zones in the rim spokes.
- Verification: three-level mesh study (Cd change between the finest two below 1 %), averaging windows for scale-resolving runs, sensitivity to the ground treatment.
- Validation targets: Cd for each rear end (and their ranking), centreline Cp on roof and underbody, base pressure.
References
- Heft, A., Indinger, T., Adams, N. (2012). Introduction of a new realistic generic car model for aerodynamic investigations. SAE Technical Paper 2012-01-0168. doi:10.4271/2012-01-0168
- Ashton, N. et al. (2024). DrivAerML: High-fidelity computational fluid dynamics dataset for road-car external aerodynamics. arXiv:2408.11969
- Celik, I.B. et al. (2008). Procedure for estimation and reporting of uncertainty due to discretization in CFD applications. Journal of Fluids Engineering, 130(7), 078001.
- Varney, M., Passmore, M., Wittmeier, F., Kuthada, T. (2020). Experimental data for the validation of numerical methods: DrivAer model. Fluids, 5(4), 236. doi:10.3390/fluids5040236
Data licences. DrivAerML reference data: CC BY-SA 4.0. Wind-tunnel data: NWTF DrivAer experimental dataset (Varney et al., Loughborough University and FKFS), used under CC BY-NC 4.0. Where shown, it is re-plotted against our simulations; the measurements themselves are not changed.